
Unless we act, climate change will affect your ability to ski or snowboard. Snowpack is reduced, snow conditions are more variable, weather events become more extreme, and low-to-no snow winters become more common.
Together, we can change snow conditions! Will you do your part? Read on to learn more about how climate change impacts the Tahoe Basin. To act now, visit Save our Snow and the Carbon Reduction Calculator for ways we can work together to limit the worst-case conditions of climate change on our winter fun.
Learn about Climate Change Impacts
Scroll down to learn more about the effects climate change will have on the following, and what you can do about it!
- Less desirable snow conditions
- Fewer days with below-freezing temperatures
- Decreasing snowpack
- Snowline rising to higher elevations
- More weather extremes
- Low-to-no snow winters
1. Less desirable snow conditions
Light, fluffy, powdery snow created by super cold atmospheric temperatures are the mountain conditions that skiers and snowboarders dream about.
As air temperatures rise, the snow is more likely to trend towards dense, wet, and heavy snow. This already cement-like snow will get even denser (sloppier) once it's on the ground. These conditions can be slow, difficult, and even dangerous in some situations.
Ski resorts have already begun to invest in compensating for this lack of snow by creating artificial snow, but this only adds to the carbon emission levels of the area. Additionally, this process is only possible when nighttime air temperatures reach below-freezing, a phenomenon that is becoming less frequent.
Data from regional temperature gauges show that the average minimum temperature in our region now exceeds freezing, which is leading to more rain and less snow, as well as less desirable ski conditions.
Air Temperature - smoothed daily minimum
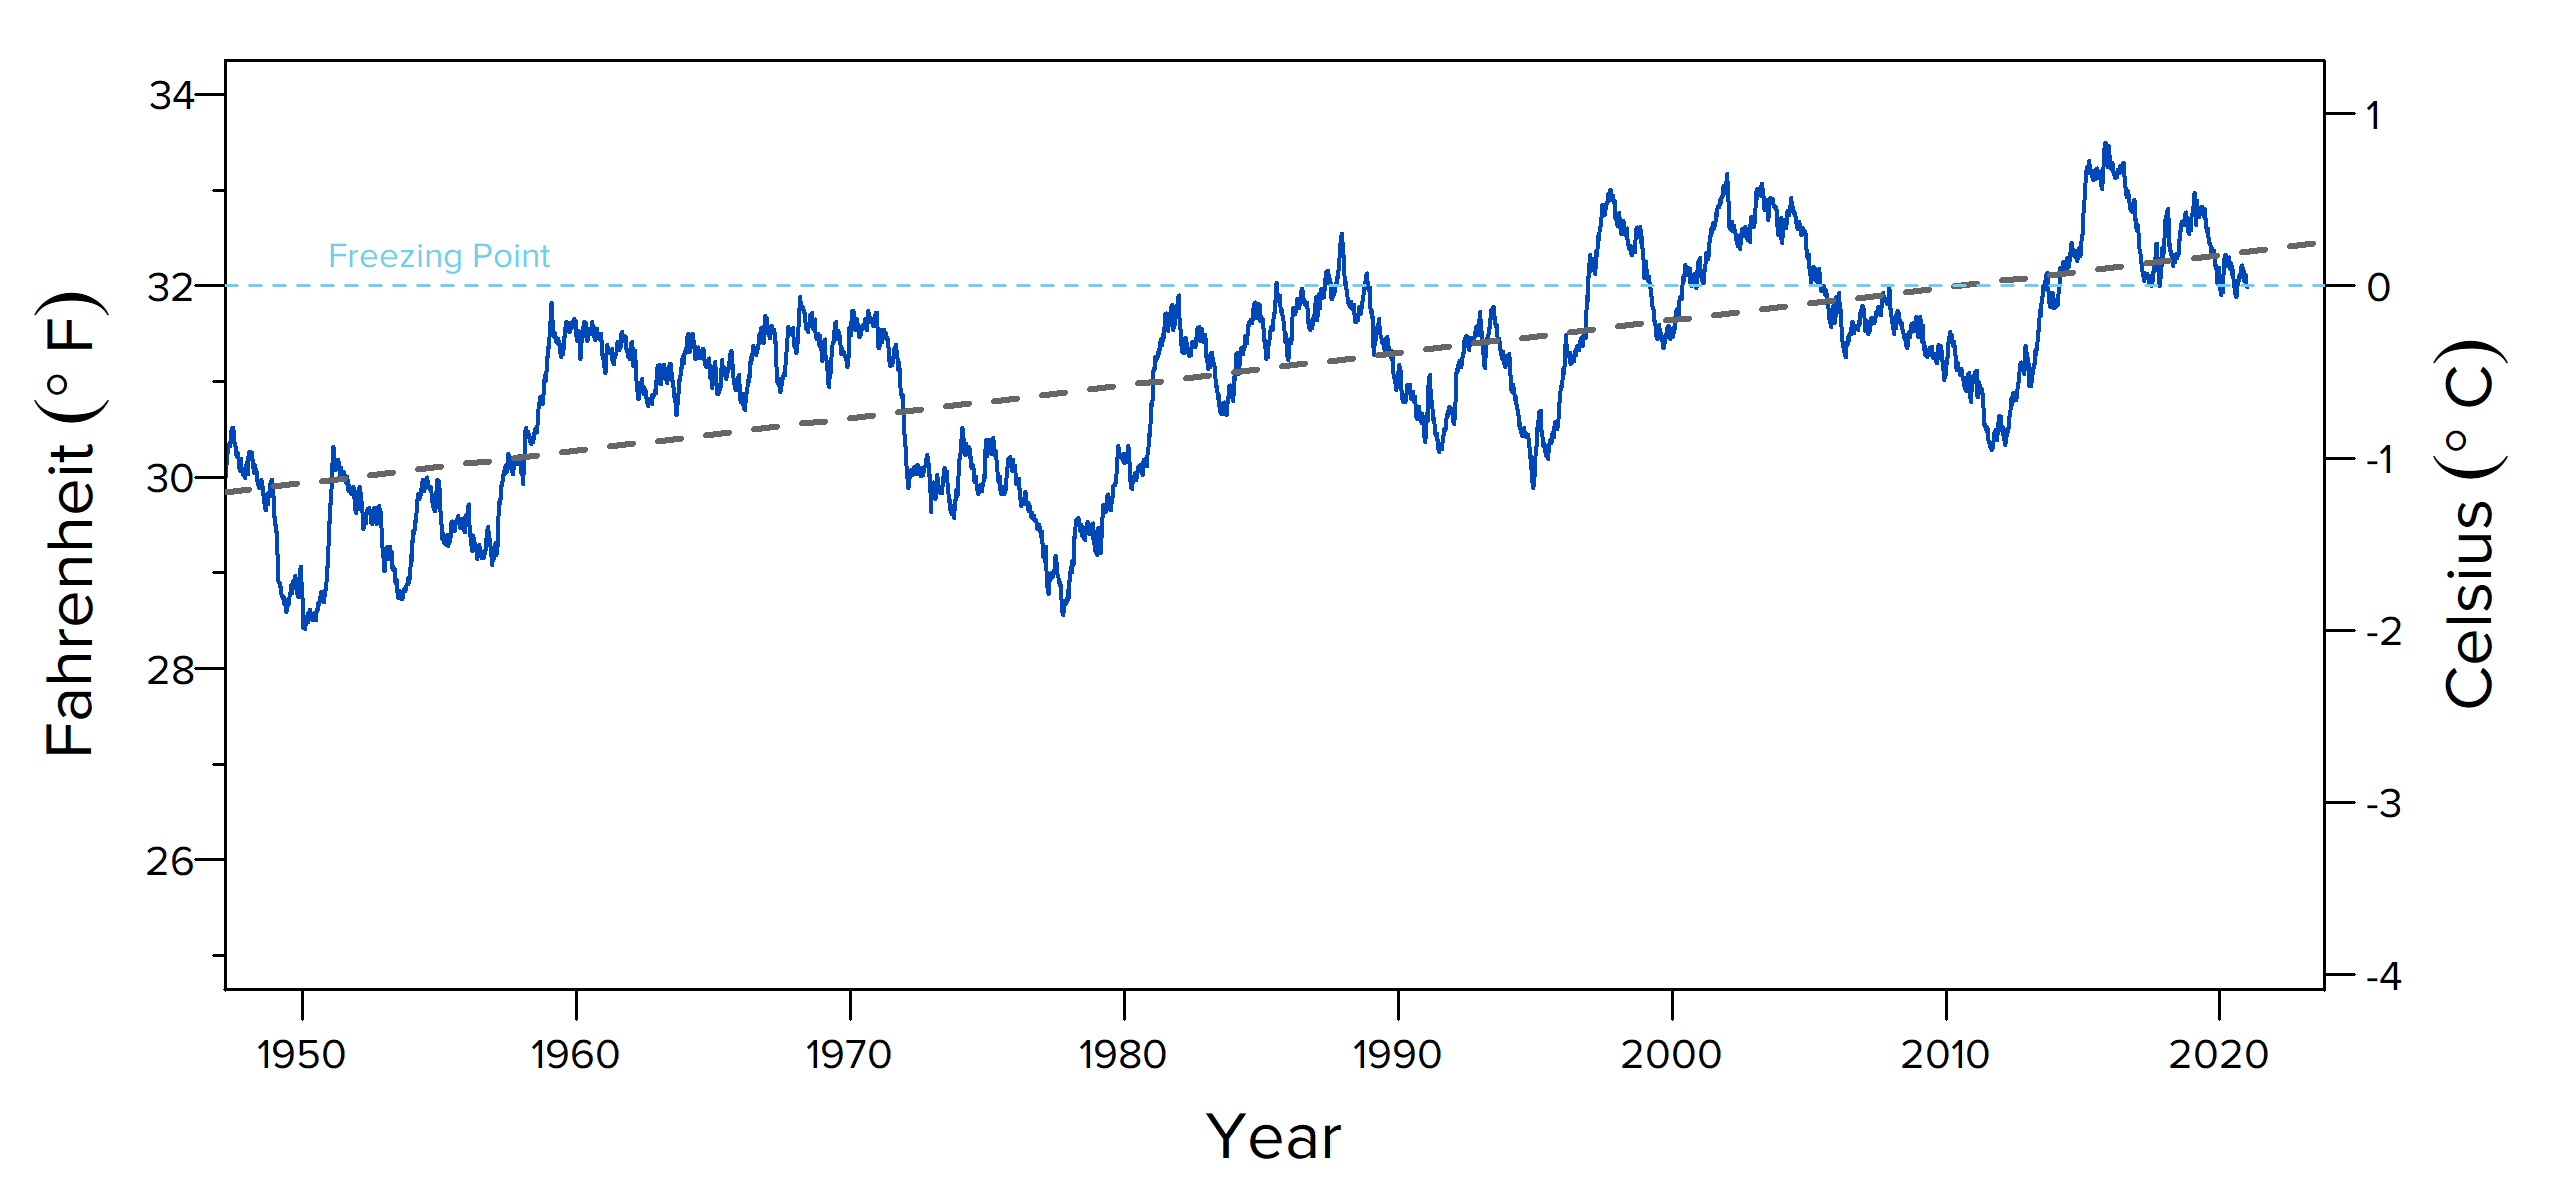
2. Fewer days with below-freezing temperatures
Snow forms when the atmospheric temperature is at or below freezing (0°C or 32°F) and the ground temperature is cold enough.
Although year-to-year variability is high, the number of days when air temperatures averaged below-freezing has declined by almost 30 days since 1911. Not only is the snow getting heavier and concrete-like, but there are increasingly fewer days when it's even cold enough to snow.
Below-freezing air temperatures
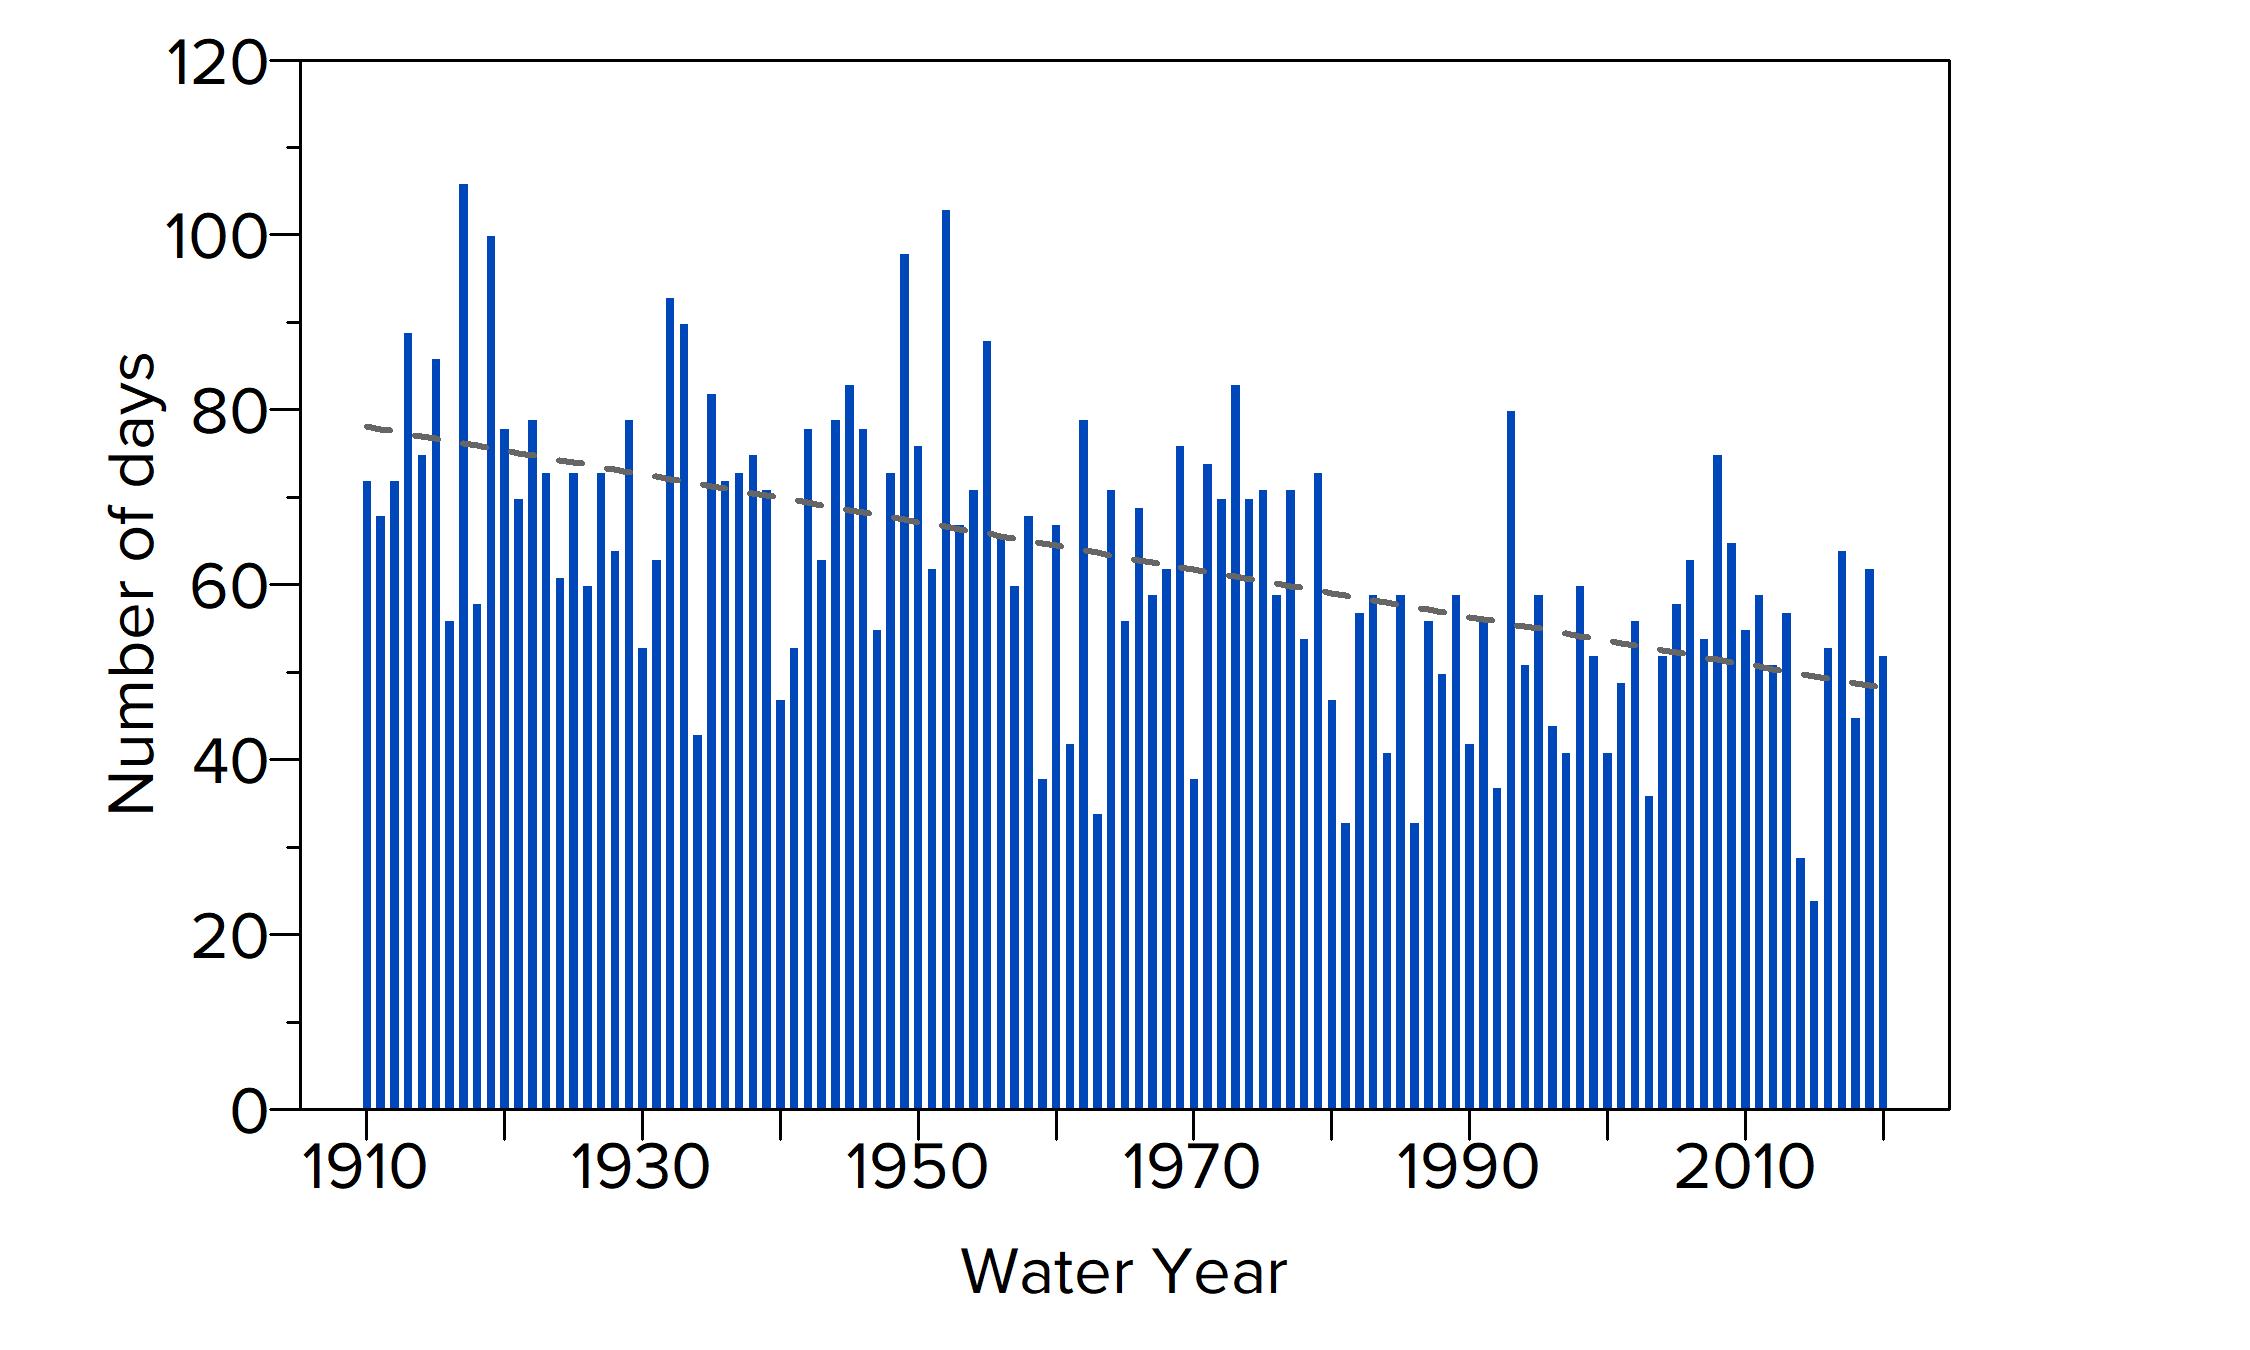
Source: UC Davis TERC State of the Lake Report 2021
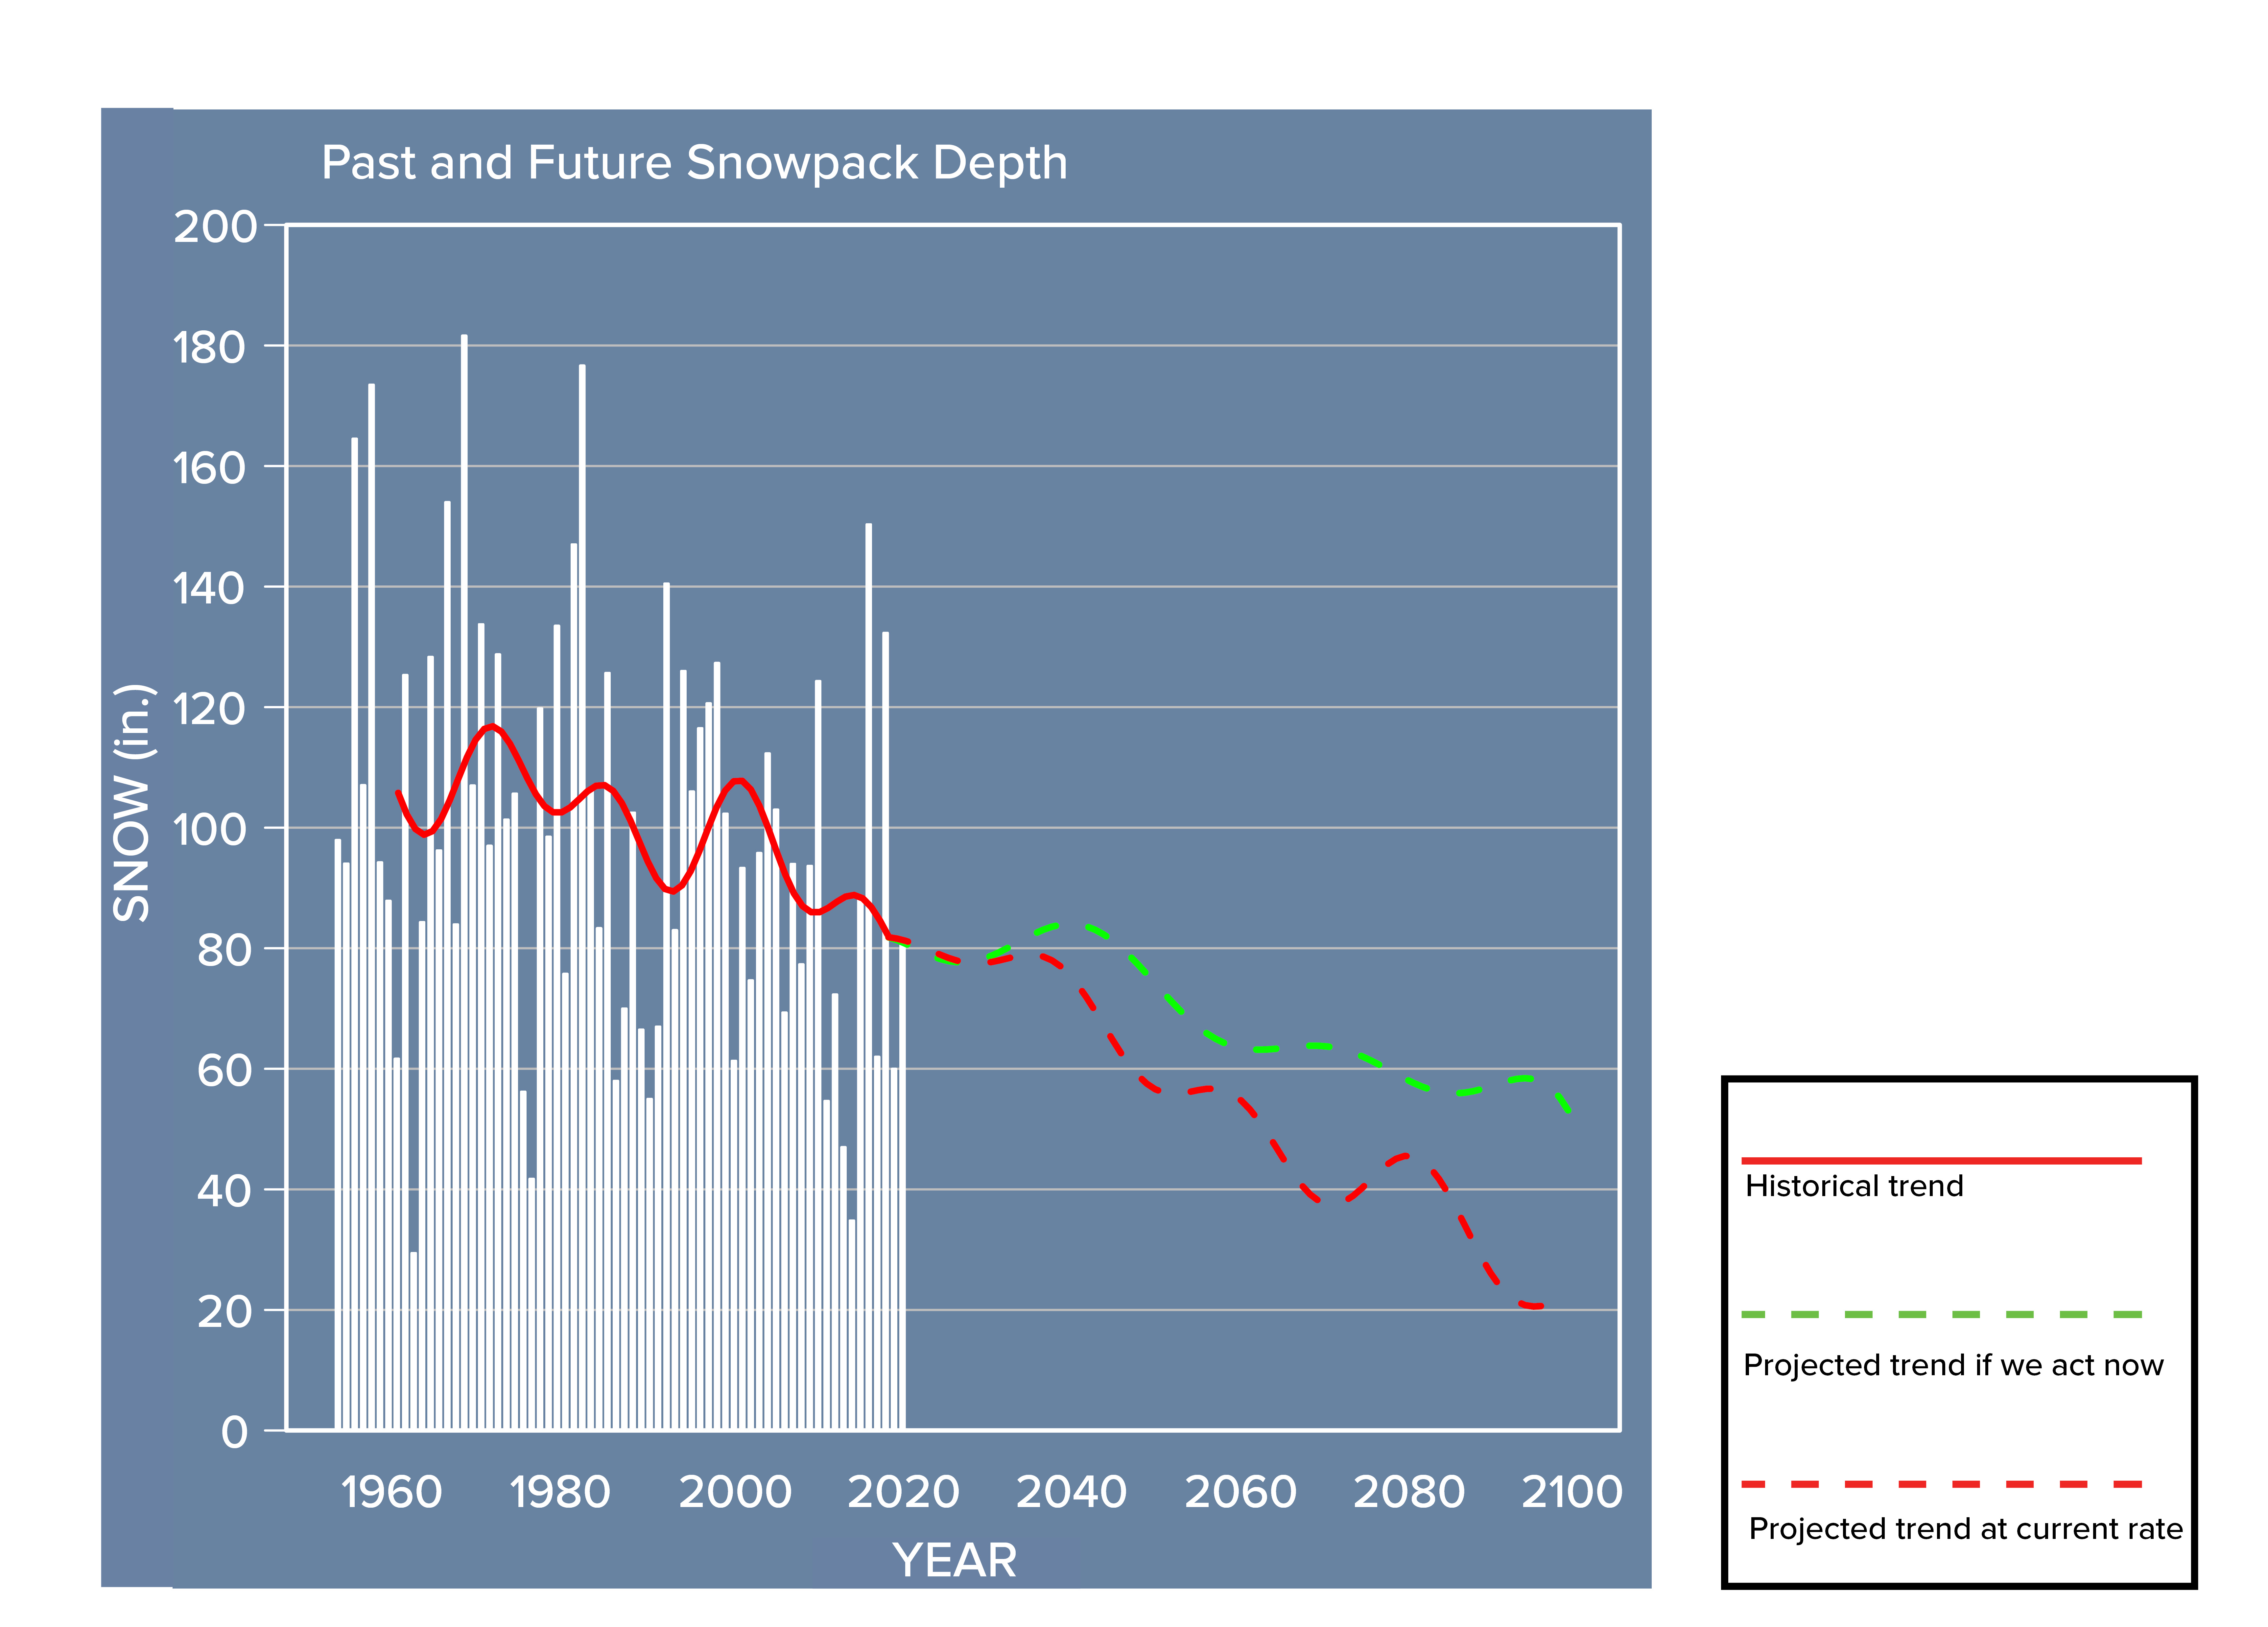
3. Decreasing snowpack
Our average local snowpack has been decreasing since snowpack data was first collected. While winter seasons are punctuated with extreme high and low snow years, the graph below shows the overall decline in snowpack at Palisades Tahoe since the 1950s.
Future projections shown in red and green dashed trend lines are based on the current emissions rate (red) and if-we-act-now rate (green), respectively. We can Save Our Snow by reducing carbon emissions starting today. Learn the easy ways you can act by by pledging to cut carbon emissions with our Carbon Reduction Calculator.
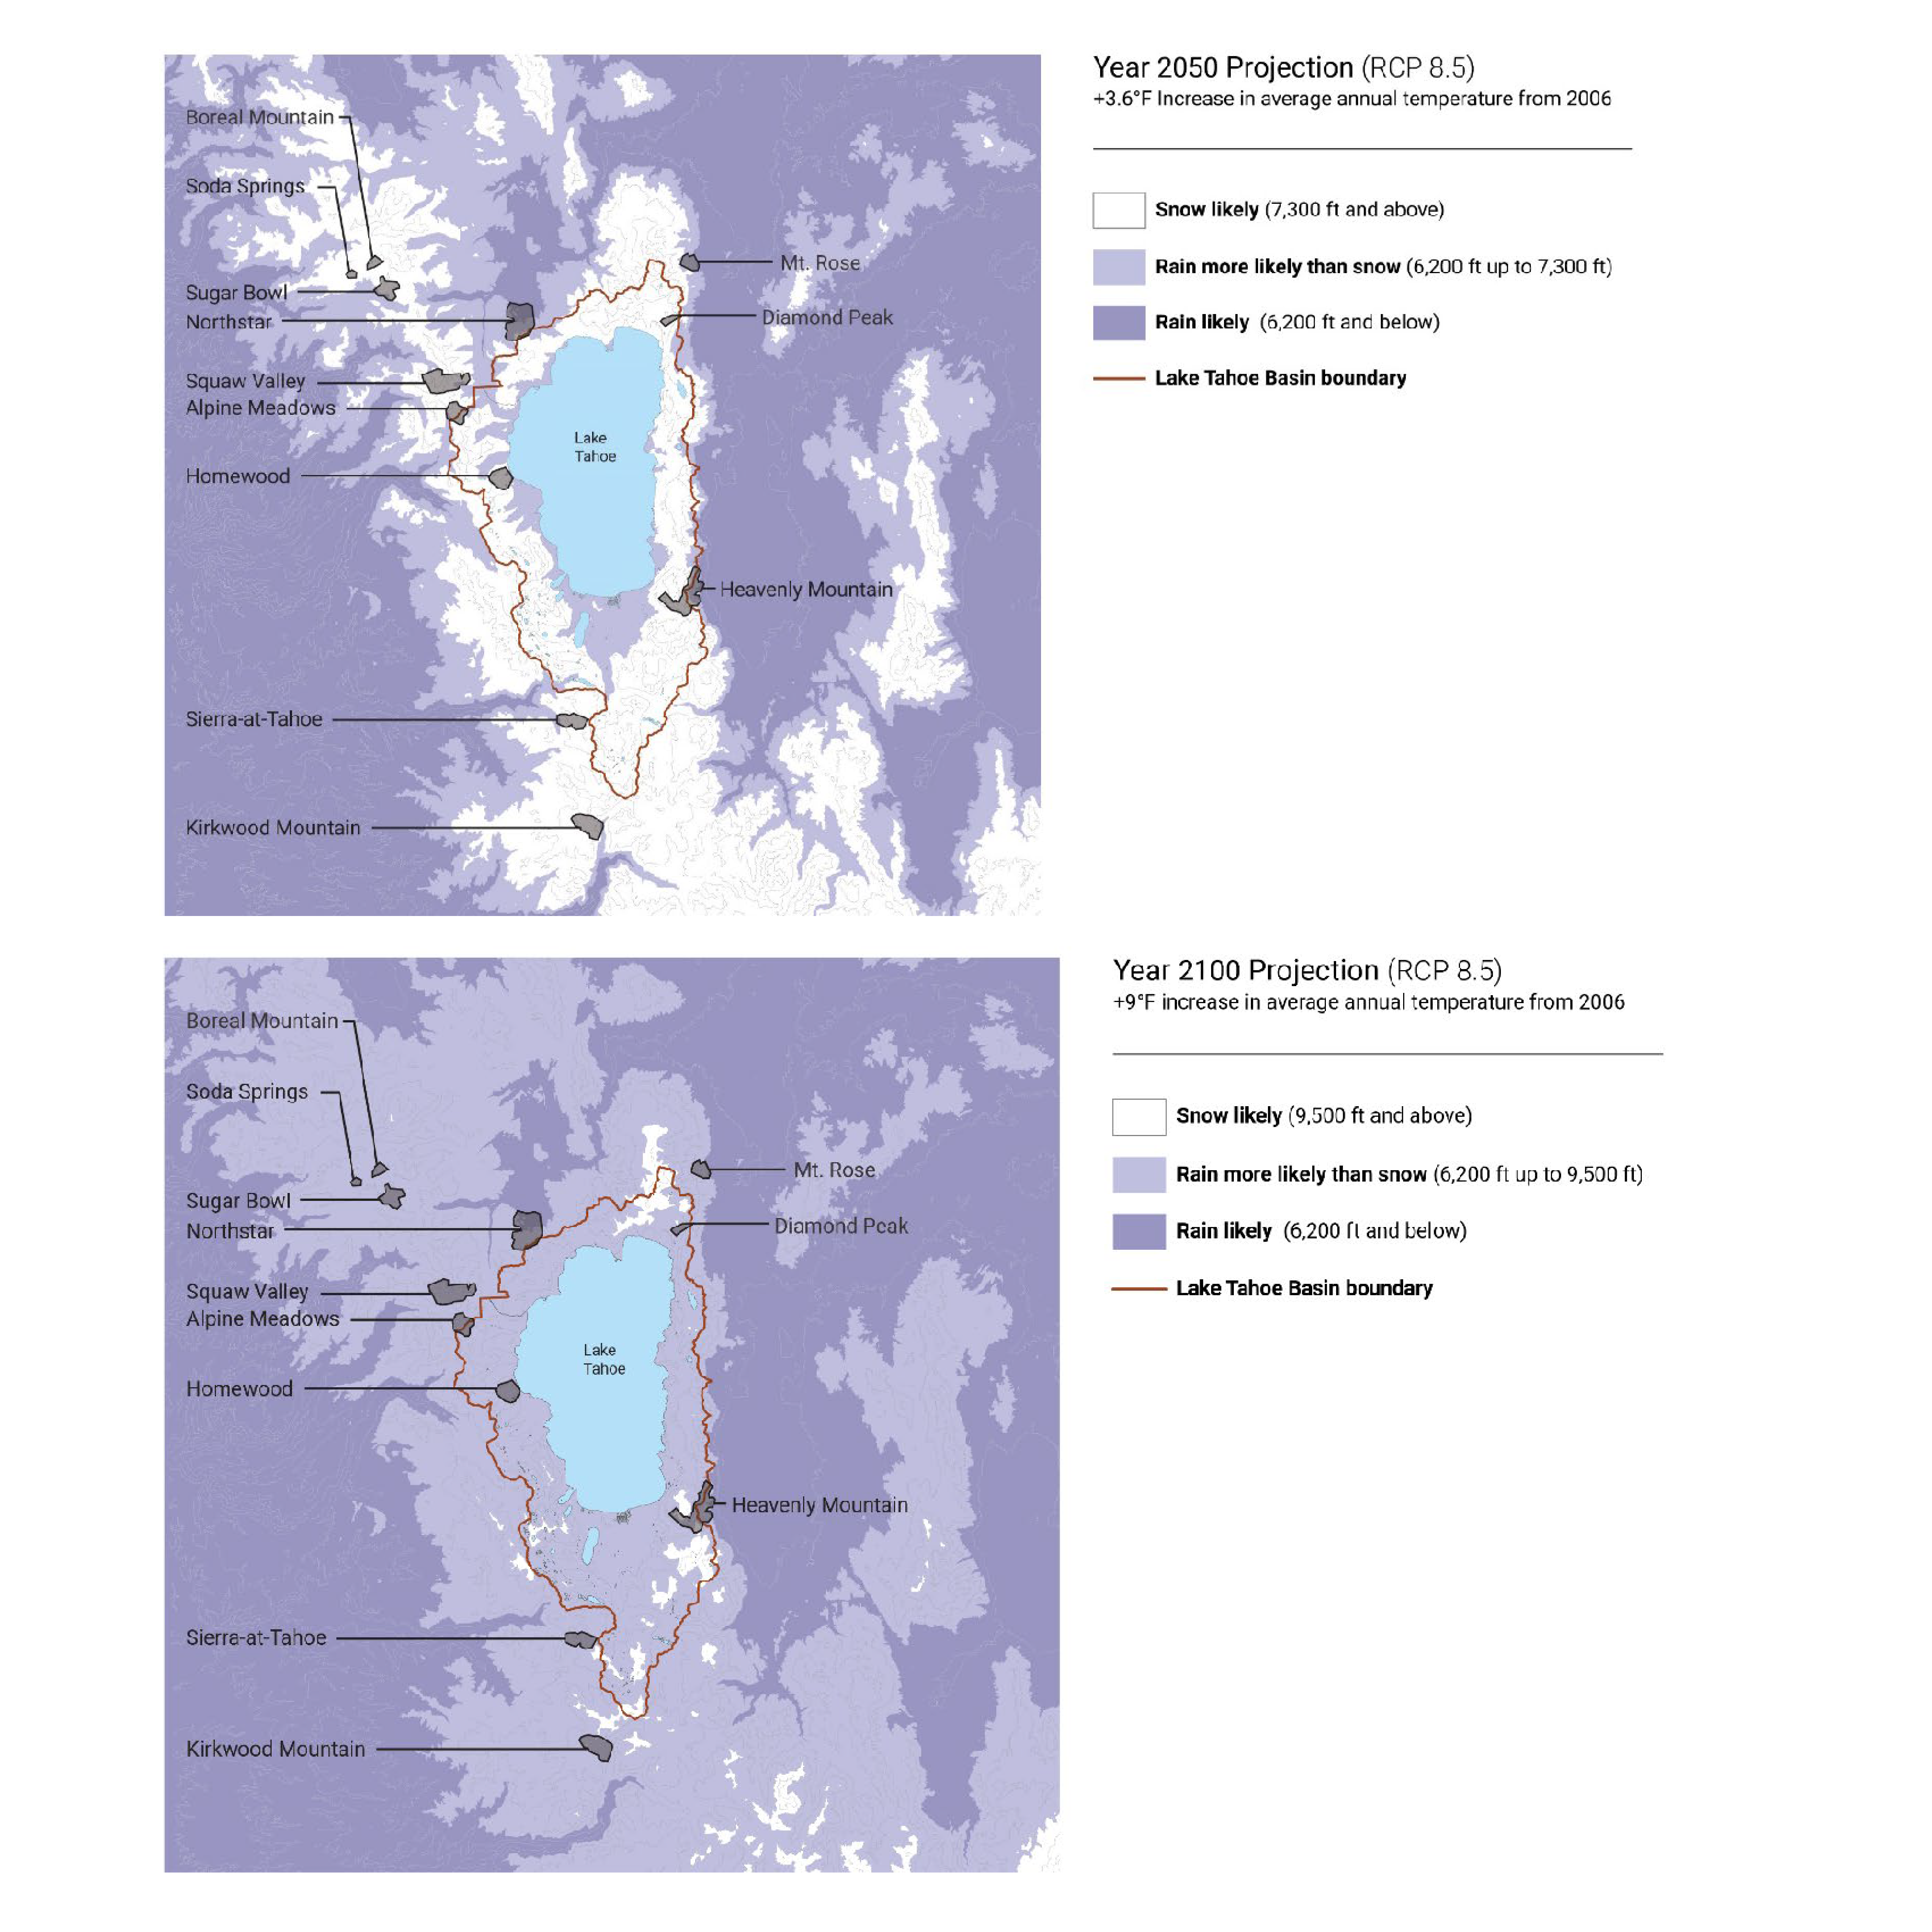
4. Snowline shifting to higher elevations
Snowpack is projected to decline over the next few decades. If we continue at the current carbon emissions rate (RCP 8.5), rain will be increasingly more likely than snow in areas up to 7,300 feet in elevation by 2050. By 2100, rain will be more likely than snow up to 9,000 feet in elevation. Not only will there be less natural snowfall, but the snowpack won't last as long due to the warmer temperatures that increase snowmelt intervals. When rain reaches so far up in the basin and when it falls on any remaining snowpack below that storm-time snowline, the rain can cause rapid snowmelt and runoff that ends up flooding down below, disrupting road access and damaging meadows, ski runs, buildings and ultimately the Lake.
For reference, Lake Tahoe is at an elevation of 6,240 feet and Freel Peak (the tallest peak in Tahoe) is 10,891 feet. Only two ski resorts in the Tahoe Basin have peaks at over 9,000 feet in elevation. Your favorite ski resort may only have natural snow for the next few decades, so if we do nothing you may have to get it while you can!
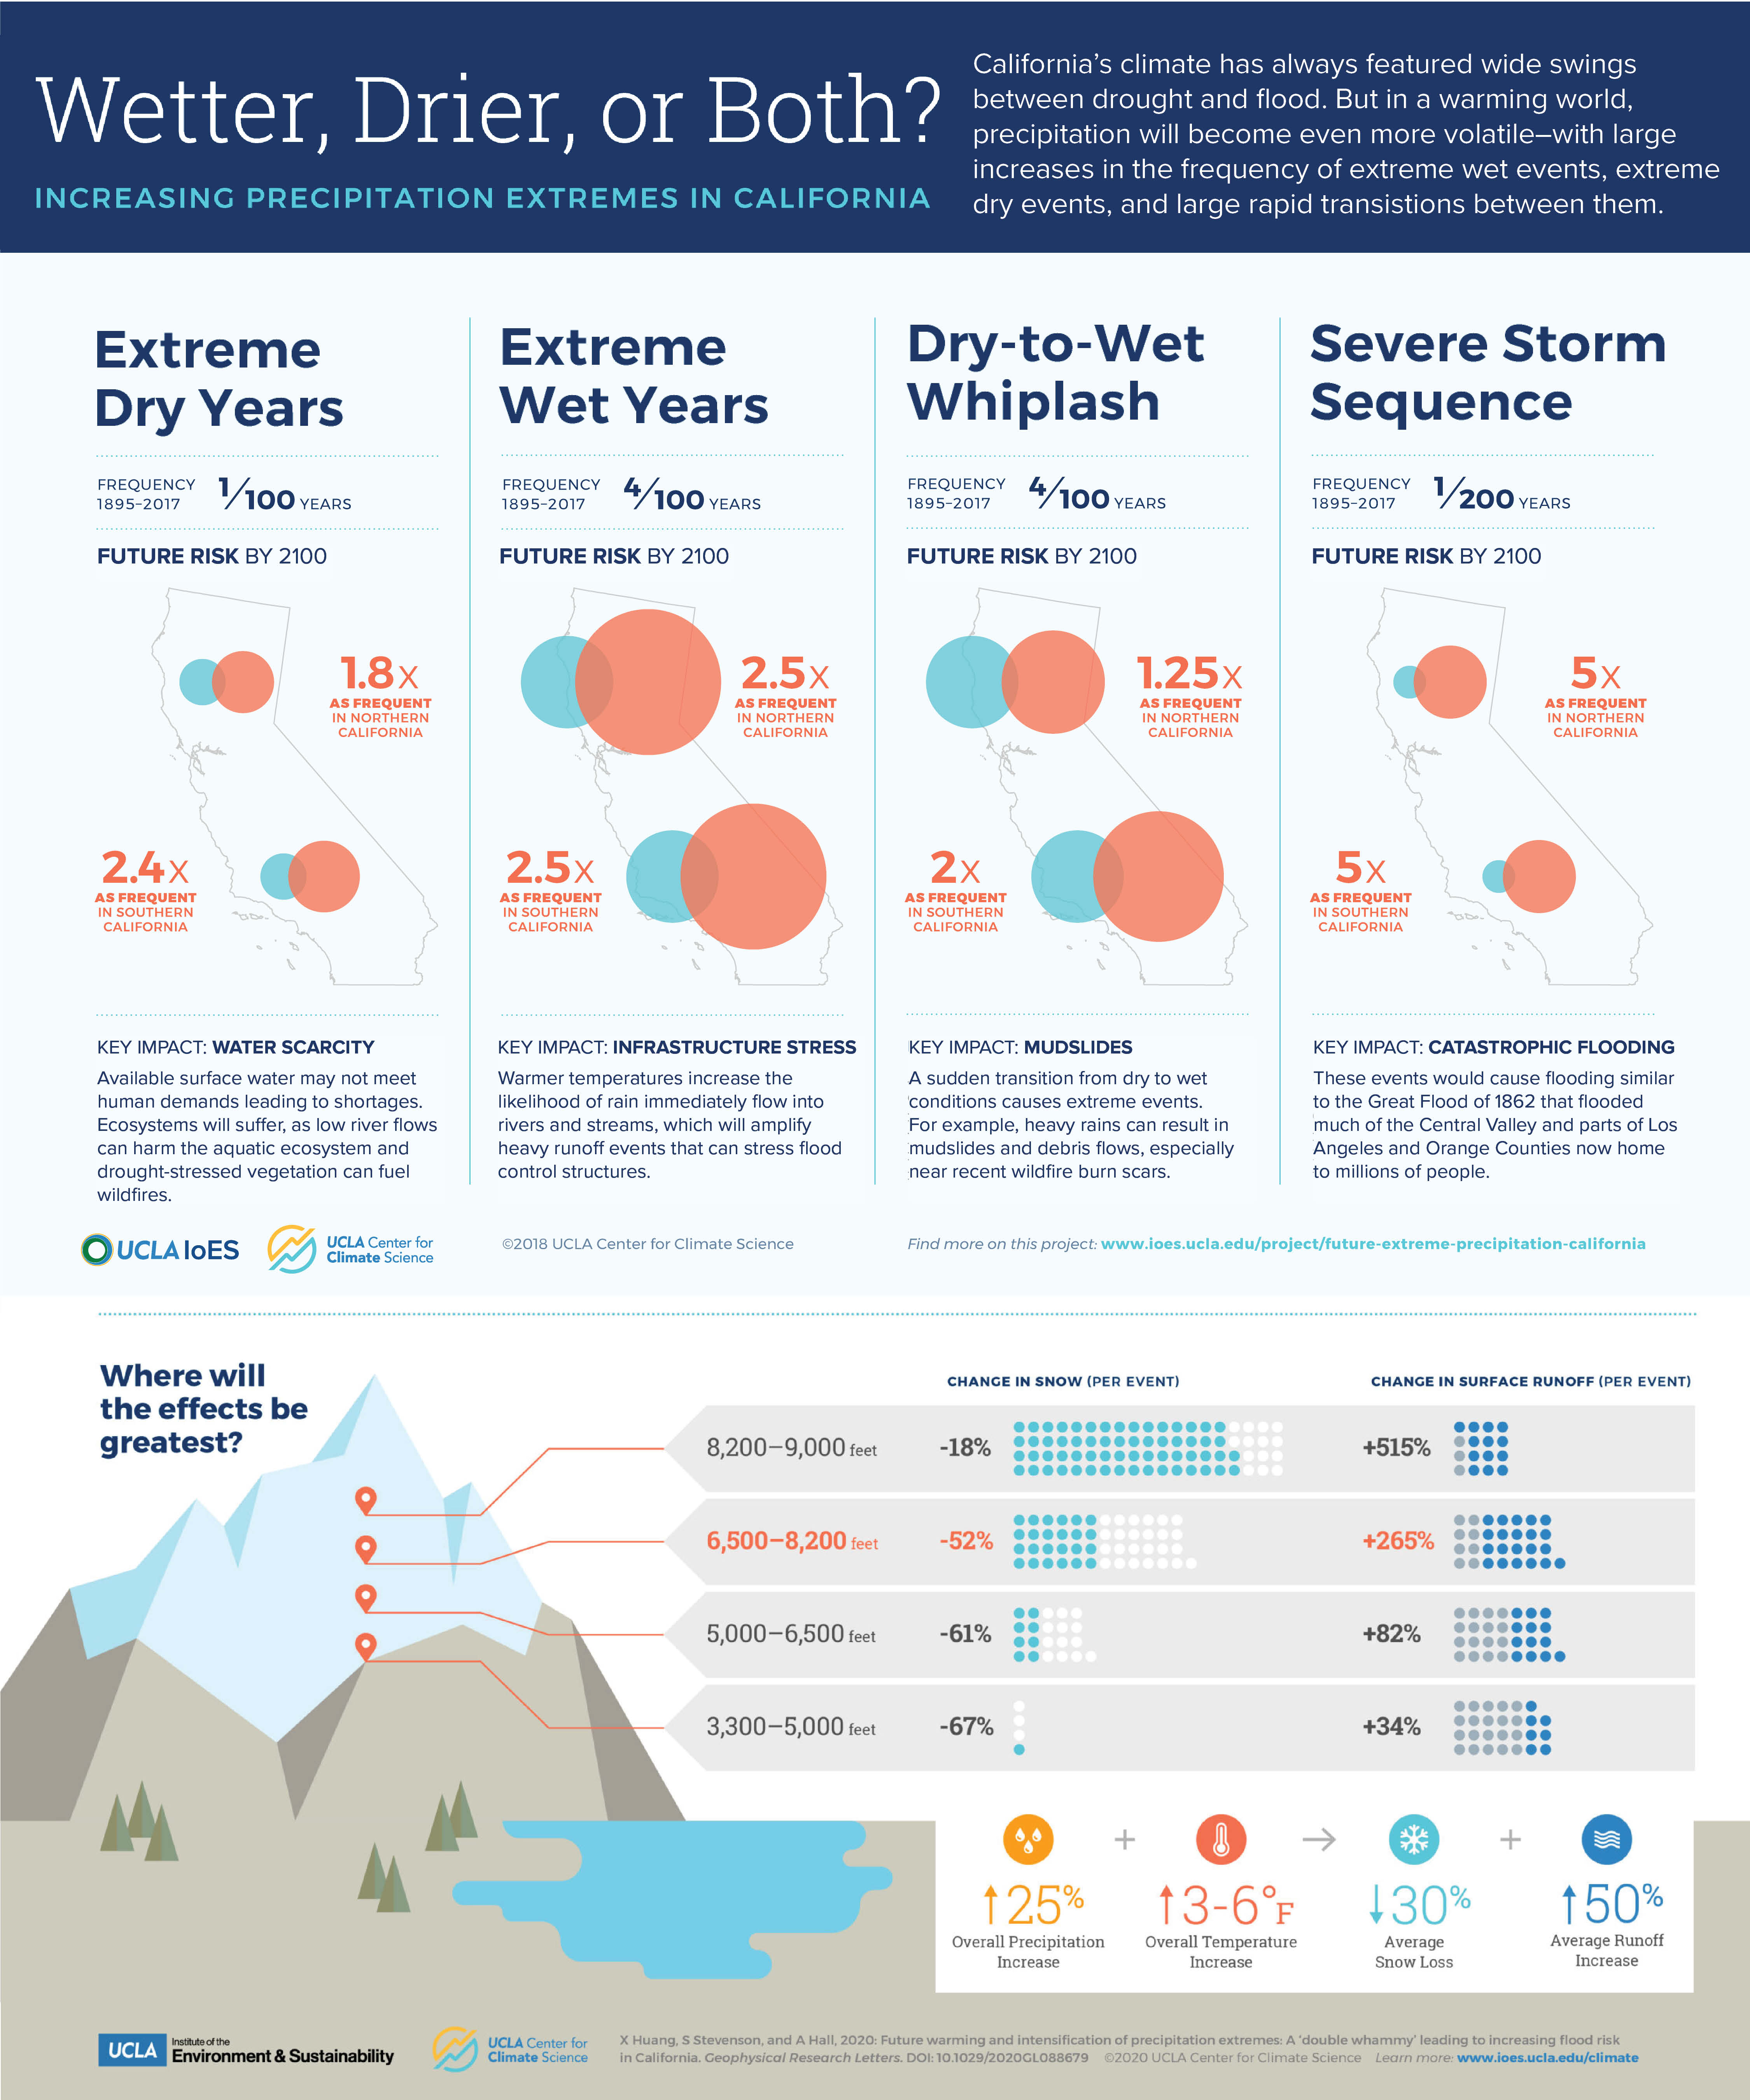
5. Increasing frequency of weather extremes
As weather extremes caused by climate change become more frequent, it becomes increasingly difficult to predict the already temperamental mountain weather. This has resulted in what climatologists refer to as "precipitation whiplash," meaning the future climate in the Sierra will be studded with extremely dry years that are immediately followed with extremely wet years. This increases the likelihood of flooding, wildfire, and mudslides. And while extremely wet years may sound enticing, severe storms may prevent resorts from opening due to avalanche control issues and problematic lift operations.
The changing climate has huge implications for mountain economies based largely around winter tourism, local homeowners, and those investing in property near ski resorts. See the current risk (blue circle) in comparison to future risk (orange circle) below.
6. Low-to-No snow winters
According to Managing Water Resources in a Low-to-No-Snow Future from the Lawrence Berkeley National Laboratory, "many regions have already experienced winters with very little snow in recent years, such as the Sierras in 2015 when the April 1 snowpack level was 5% of normal, which the authors call an “extreme” event.” Besides 2015, the lowest snow years ever recorded have been 1977 and 2014, both of which yielded five times as much snow as 2015. So 2015 really WAS a very low-snow year! But years like 2015 are expected to become more and more common in decades to come, unless we do something starting now.
Several types of low-to-no-snow conditions are defined as:
- “Low-to-no snow”: when the snowpack (or more precisely, the snow water equivalent, a measure of how much water will be released when the snowpack melts) is in the 30th percentile or lower of the historical peak.
- “Episodic low-to-no snow”: when more than half of a mountain basin experiences low-to-no snow for five consecutive years.
- “Persistent low-to-no snow”: when more than half of a mountain basin experiences low-to-no-snow 10 consecutive years.
California could experience episodic low-to-no snow as early as the late 2040s and persistent low-to-no snow in the 2060s. For other parts of the western U.S. persistent low-to-no snow emerges in the 2070s.

These satellite images show snow pack for a high (left, March 2010) and low (right, March 2015) snowpack conditions. Snowpack in California's Sierra Nevada in 2015 was at the lowest level in the past 500 years, and we can expect more years like this due to rising temperatures. (Credit: NASA)
What do we do now?
The changing climate impacts goes beyond our enjoyment of snow. The Sierra snowpack is critical to a myriad of factors that affect the entire Western U.S. including plant and forest health, atmospheric conditions, available water resources, and wildfire impacts.
Now that you know… What will you do to Save Our Snow?
- 1This project was made possible in part by the Institute of Museum and Library Services (IMLS) Grant MA-245954-OMS-20. The views, findings, conclusions, or recommendations expressed on this website do not necessarily represent those of the Institute of Museum and Library Services.